About the algorithm:
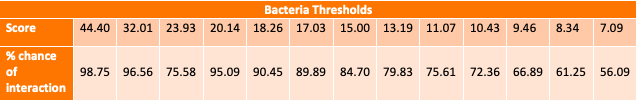
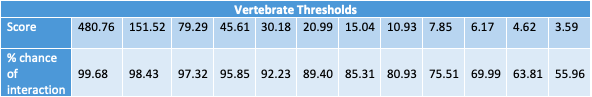
This tool is useful for anyone who wishes to look for potential protein-protein interactions. Our algorithm calculates a mutual information based score for each residue-residue interaction between two proteins. It then takes the highest of those scores and calculates a likelihood of interaction for the pair. This likelihood is calculated based on several different score thresholds (see below tables) which were determined by comparing the scores of 2,102 known human protein interactions reported in GPS-Prot and 233 bacterial protein interactions reported in the STRING database, with a respective 1,975 and 252 protein pairs not reporte to interact. In the case that a score falls below a certain number, prediction of interaction is not possible for this particular tool. Because this particular calculation metric relies on coevolution to determine protein interaction, if the interaction in question is not between two proteins that interact but have been largely conserved or only recently evolved then this tool will not detect that relationship. Therefore, a lack of information indicating an interaction is not the same as indication of non-interaction.
Usage
Exploring the Database
As we've already run our algorithm on several gene pairs, we decided to include those results on our website for fast browsing. Note that these pairs are different from those used to determine the thresholds. The database of gene pairs is not fully connected, so the second list of possible proteins will dynamically update to reflect what proteins have been compared with protein that has been selected from the first list. Most of the available pairs contain at least one protein known to be part of the pathology of Alzheimer's Disease.
Uploading your own files
If the interaction that you're interested in is not available in the database, you may upload your own FASTA files. Our tool will quickly calculate the mutual information based scores, give the highest score, the location of the highest score, and the likelihood of interaction based on that score. A csv file containing all scores and a heat map are also generated and are made available for download. In the csv file, each row represents a residue in the first entered protein and each column represents a residue in the second. If you wish to see more information on the algorithm itself or run the algorithm on your own machine, see our github repository.